The Cash Conversion Cycle is a metric that tells us how long it takes the company to convert capital invested in inventory back to cash.
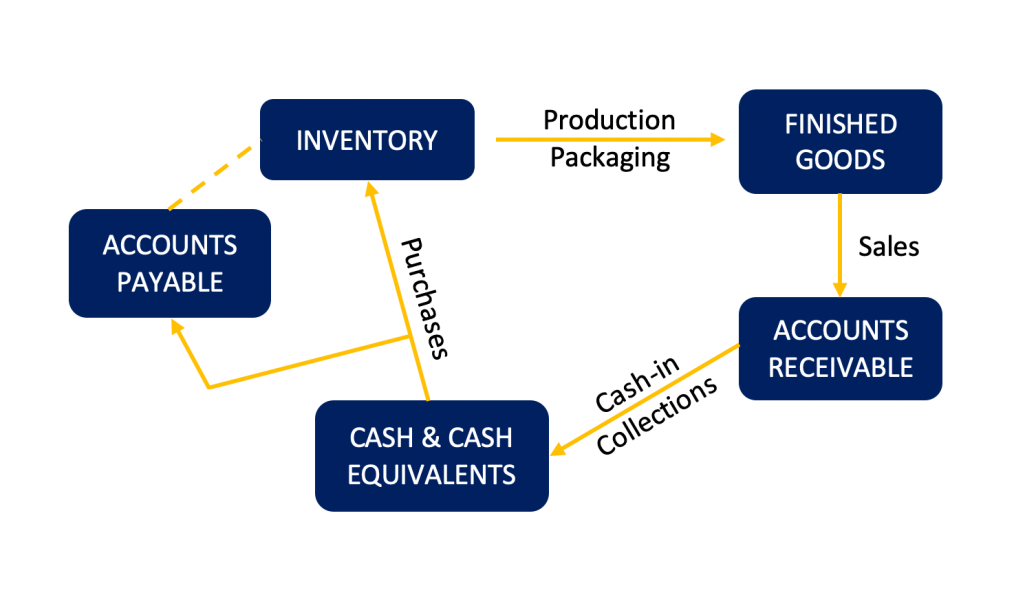
Here’s a cool-looking process diagram to illustrate the cash conversion cycle:
Elements of the Cash Conversion Cycle
The Cash Conversion Cycle is a combination of several activity ratios, that we can use to analyze a company’s performance.
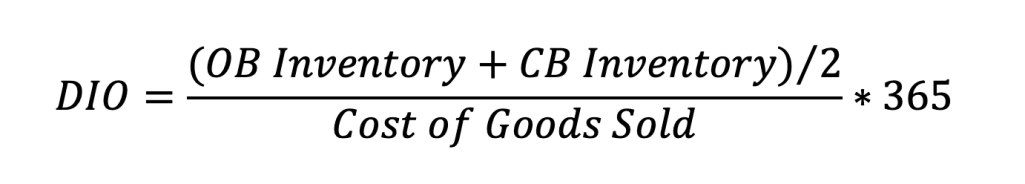
DIO – Days Inventory Outstanding
The DIO ratio shows us the average time it takes to convert inventory into sales, the time a company holds its inventory before selling it.
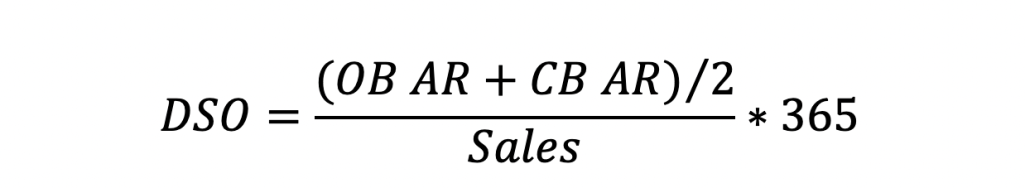
DSO – Days Sales Outstanding
The DSO metric shows the average time the company takes to collect its receivables.
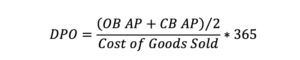
DPO – Days Payables Outstanding
The DPO shows us the average time it takes for the company to cover its payables to suppliers.
Considering the three ratios, the Cash Conversion Cycle shows us the time it takes to purchase inventory/raw materials, sell inventory/finished goods, and collect the trade receivables from the sales. Basically, the CCC calculation outlines the period between cash disbursements and cash receipts.
Cash Conversion Cycle in Financial Analysis
The CCC formula aims to measure how efficient management is in running working capital. The shorther the cycle is, the better.
Usually the Cash Conversion Cycle is analyzed over more than one period, so trends can be identified. Doing so can show us whether working capital management is improving over time or not.
We can use the Cash Conversion Cycle to benchmark the company against competitors, or similar companies and industries.
The Cash Conversion Cycle can’t be observed in the Cash Flow Statement, because of investment and financing activities that introduction distortion in the provided information.
Analyzing CCC can help us to identify possible improvement options in cash management and policies for credit sales and credit purchases.
The metric is also very useful when comparing businesses. For close competitors, the one with lower CCC is almost always in a better financial position.
The Cash Conversion Cycle outlines how efficiently management is using short-term assets and liabilities to generate cash, and helps potential investors to measure a company’s health.
Online retailers can go to a negative cash conversion cycle, when they negotiate terms where they pay vendors after they have collected the trade receivables for the same goods.
Having bad credit history with suppliers slows down the Cash Conversion Cycle, as they won’t give us access to bether credit terms. Poor collection of accounts receivable and piling up inventory also slow down the CCC.
Uses in Budgeting and Modeling
Financial analysts use the Cash Conversion Cycle in building economic models for Discounted Cash Flows (DCF) valuation, budgeting and forecasting.
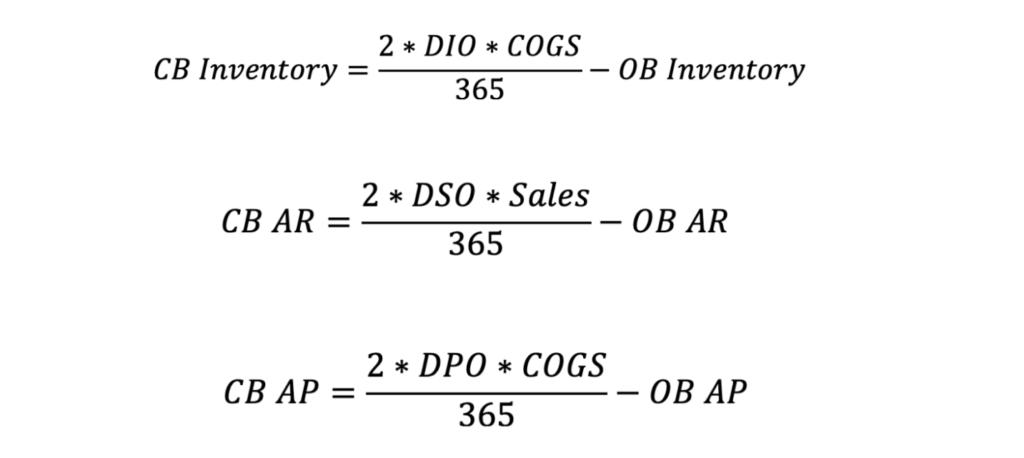
We can also calculate the CCC over the historical data and use it to estimate Inventory, Accounts receivable and Accounts payable. We achieve this by flipping the formulas from the model.
That way, we get the following three formulas:
Working Capital Forecast with CCC
To understand how useful the Cash Conversion Cycle is when forecasting, let us look at an example.
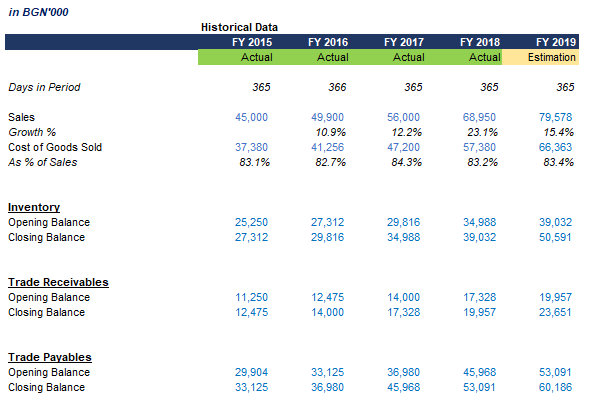
We have the historical data of our company, actual for the years 2015 to 2018, and estimation for 2019. We have information on Sales, Cost of Goods Sold, as well as working capital opening and closing balances.
We aim to forecast the balances of the working capital accounts for the next five years.
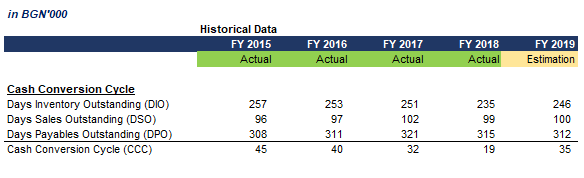
To do so we will first start by calculating our Cash Conversion Cycle metrics for the historical period.
Applying the formulas we looked at earlier, we get the following CCC.
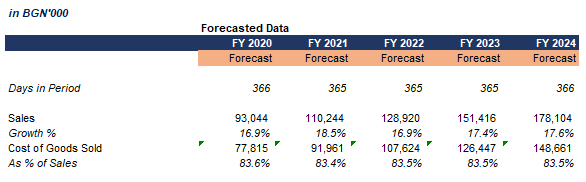
Next, we need to forecast Sales and COGS as these are used to calculate working capital via the Cash Conversion Cycle formulas. Usually, we prepare those estimations with more thorough analysis and modeling. For this example, we will forecast Sales based on a 3-period moving average of the growth rate. For COGS we will take a 3-period moving average on the % of Sales that it represents and forecast it based on that assumption.
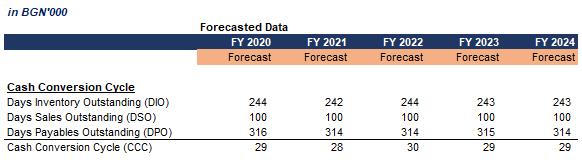
Now that we have the Sales and Cost of Goods Sold figures, we can forecast our Cash Conversion Cycle metrics. Our historical data shows more or less stable CCC. Therefore a 3-period moving average should be OK as a forecasting technique here. Applying this approach gives us the following metrics for the period 2020 to 2024:
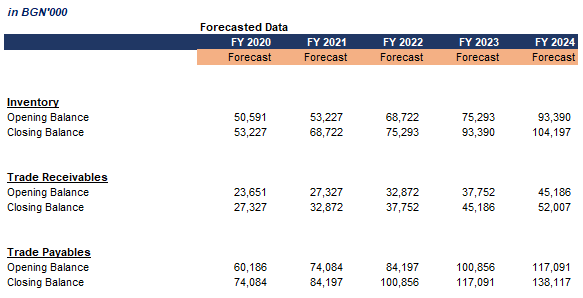
Now that we have all the required parameters, we can use the reverse formulas we discussed in the previous section and calculate the closing balances of working capital accounts based on Sales/COGS and the respective Days Outstanding metric. Applying the formula we get the following balances over the years in the forecasted period.
We looked at a short example to illustrate how the Cash Conversion Cycle concept would be used in a budgeting exercise when forecasting working capital balances.
Conclusion
The CCC is amongst several metrics to evaluate management over time and compared to other companies.
The Cash Conversion Cycle is useful for companies that operate with extensive inventory and mostly physical products.